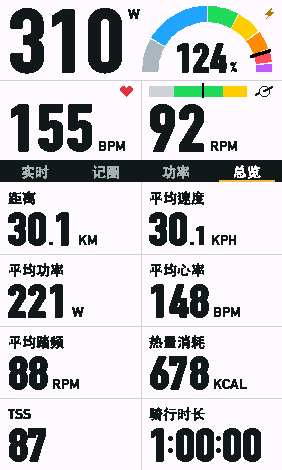
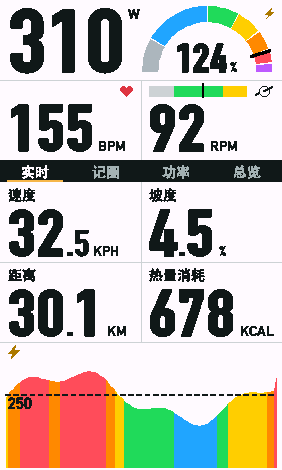
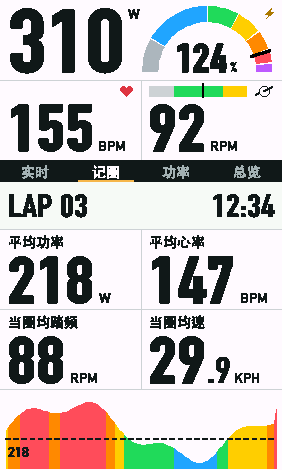
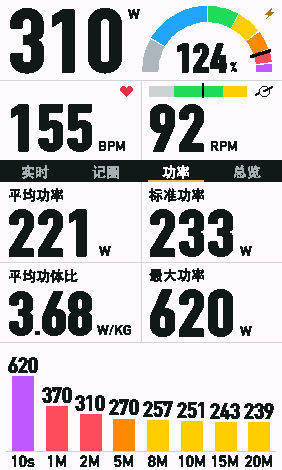
PHLASH is a completely free full-screen Connect IQ data field. No activation code is required. Core readings stay at the top, with Live, Laps, Power and Summary available as soon as you install it.
Screenshots use the same generated ride in the native Edge 1040 simulator, with an example FTP of 250 W. Charts and bars use power-zone colors. Set your own FTP after installation.
01 Install on a full data screen
Supported devices: Edge 830, 840, 850, 1030, 1040 and 1050. PHLASH is an activity data field and needs a one-field screen layout.
Install PHLASH from the Connect IQ Store and wait for it to sync. On your Edge, open your cycling activity profile and its data screens. Add or edit a screen, choose a one-field layout, then select PHLASH under Connect IQ data fields. Menu names vary by device.
Pair your power meter, heart rate monitor and cadence sensor through the Edge's native sensor menu. PHLASH uses activity and sensor readings provided by the device.
02 Configure and start riding
All four pages and all features are free. No purchase, subscription or activation code is required. PHLASH opens on Live; tap the middle tabs to switch pages.
In the phone Connect IQ Store app, open Device → My Data Fields → PHLASH → Settings. Adjust language, personal values and displayed fields, then save and sync to your Edge.
Start the activity timer on your device to collect samples for charts and accumulated statistics. Updates preserve saved personal settings. Any activation status from an older version has no effect on the free version.
03 Explore the four pages
All six devices share a two-column layout. The core defaults to instantaneous power with a semicircular gauge, with heart rate and cadence below. Core readings remain visible across pages and can be configured. Tap the middle tabs to select a page, or tap the left or right side of the lower content area to move between pages.
Live shows one data row at a time on Edge 830 / 840 / 850: tap that row to switch between two pairs of fields. Edge 1030 / 1040 / 1050 show both rows together. Lower cells scale down on shorter screens to leave room for charts.
Screenshots show the Simplified Chinese interface. Select English or 简体中文 in settings. Screenshots use the same generated ride in the native Edge 1040 simulator, with an example FTP of 250 W. Charts and bars use power-zone colors. Set your own FTP after installation.
Summary
Eight configurable statistics in four rows of two. Defaults are distance / average speed, average power / heart rate, average cadence / calories, and TSS / moving time. Alternatives include total ascent, total descent, clock time and power or heart rate distributions.
Default fields are speed / grade and distance / calories, followed by a live power chart. The default window is 2 minutes. Edge 830 / 1030 support 1–5 minutes; the other four models support 1–10 minutes. Up to two power references can be configured.
The header shows the lap number and current-lap time. Four cells default to current-lap average power, heart rate, cadence and speed. The chart shows the last 120 seconds of the current lap, with an optional whole-lap average power reference. Use the Edge lap key to start a new lap.
Four cells default to average power, normalized power (NP), average W/kg and maximum power. Up to eight bars show best average power for selected durations: 10 seconds and 1, 2, 5, 8, 10, 15 and 20 minutes by default. A duration shows -- until enough valid samples are available.
New installations start at 0 (unset). Enter your functional threshold power to enable power percentages, zone colors, IF / TSS and references that use FTP. Raw power, charts and best-power values remain available without FTP.
Heart rate values
Maximum heart rate controls percentages and zones. Its initial value is 190 bpm; adjust it to your own value. Resting and threshold heart rate both start at 0, not a measured value. Indicators that depend on resting heart rate appear only after a valid value is set.
Weight and average W/kg
Average W/kg uses the weight in your Garmin user profile. Check that profile when the value is missing. PHLASH shows -- for missing or invalid weight and does not estimate it.
Core and page fields
Configure the main core metric, lower core fields and each page separately. The defaults shown here apply to new installations; updates preserve saved personal settings. Summary can also show power or heart rate distributions, with zone colors and bar heights proportional to valid sample time.
Zones and best-power durations
Power zones use %FTP and heart rate zones use %maximum heart rate. Select up to eight best-power durations from 5 seconds to 1 hour, or turn individual durations off.
Language
Choose English or Simplified Chinese in the phone Connect IQ app’s PHLASH settings, then save and sync.
05 Choose chart references
The Live power chart supports up to two dashed references. Hide a line, enter a custom value or use the shared FTP. Identical values merge into one line. The Laps chart can show or hide the current lap’s average power.
On a new installation, the first Live reference uses FTP. It stays hidden until FTP is set. The lap-average reference is enabled by default and appears when valid current-lap power samples are available.
Live and Laps scale to their window samples and enabled references; 0 W is valid power. For example, 150–180 W samples with a 230 W reference produce a 135–253 W range. Missing samples are not invented. Reference labels adjust to chart edges and nearby labels.
06 Common questions
Do I need to pay or activate PHLASH?
No. Live, Laps, Power, Summary and all features are free. If an older version still shows only Summary, update PHLASH, let it sync to your device, then reopen the data screen.
Why are power charts gray and percentages or TSS missing?
FTP is unset on new installations. Enter your own FTP, then save and sync. Example power values are not your threshold. Raw power and best-power values remain available without FTP.
Why do I see -- or no chart?
The reading may be unavailable, a sensor disconnected, or activity recording not started. Check sensor connections and start the activity timer. Charts and accumulated statistics need valid activity samples. PHLASH does not invent missing readings.
Installed, but cannot find PHLASH?
Check that it synced to the correct device. In the activity's data-screen settings, select Connect IQ → PHLASH and use a full, one-field layout.
Why does the same value move vertically?
Live and Laps axes follow the visible window. Peaks entering or leaving the window change the range, as do enabled reference values.
Does the store version replay simulated data?
No. PHLASH uses the Edge's real activity data. PHLASH Replay is a separate internal demonstration build, not part of the store download.
07 Support and data
PHLASH computes and displays activity, sensor and user-profile weight data on your device. It does not independently upload these readings. Profile weight is used for average W/kg; native activity recording and Garmin synchronization remain managed by Garmin.
For help, include your device model, PHLASH version, affected page and a screenshot.